Tutorial
1. How to search for binding sites in your gene set?
1.1 Select the species either in the search bar (1), in the scroll-down menu (2), or clicking on the picture (3).

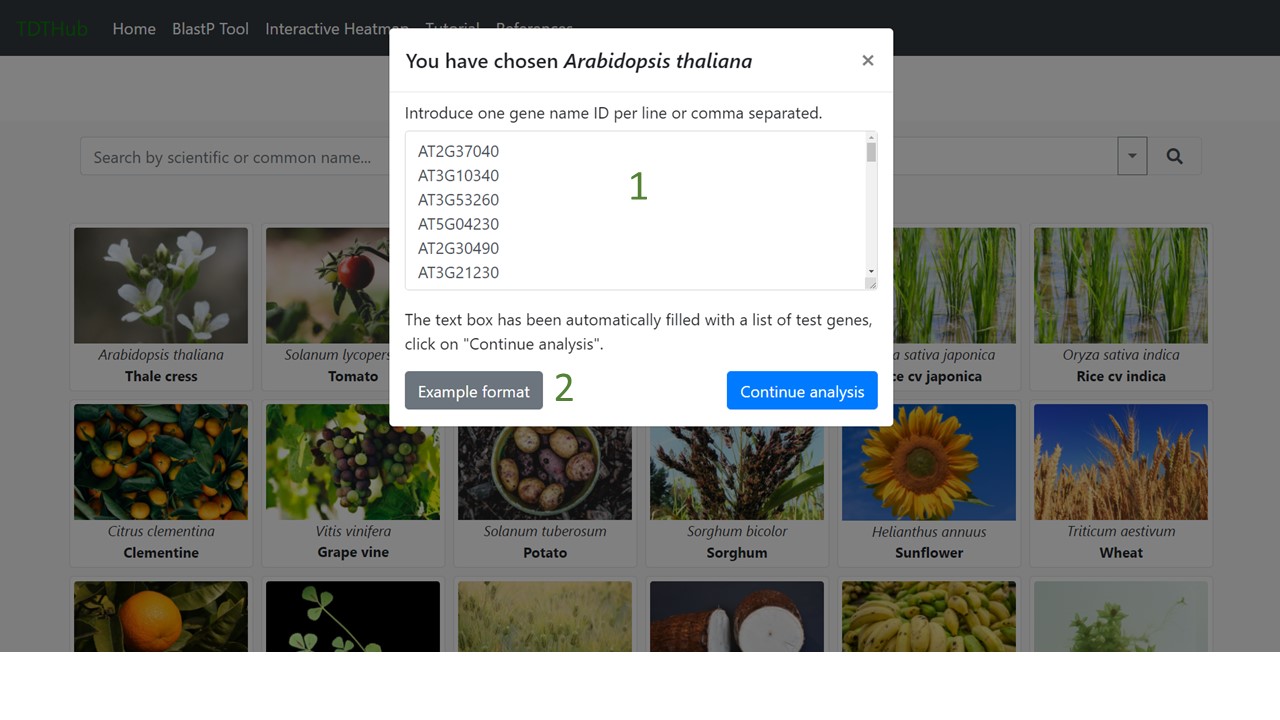
1.2 Paste the query gene set (1) and then click on “Continue analysis”. An example of the gene ID format can be seen in (2).
1.3 Select the mapping algorithm between FIMO and Cluster Buster (1). Select the gene regulatory regions to scan (2). Finally, select the desired output (3) and click on "Search" (4).

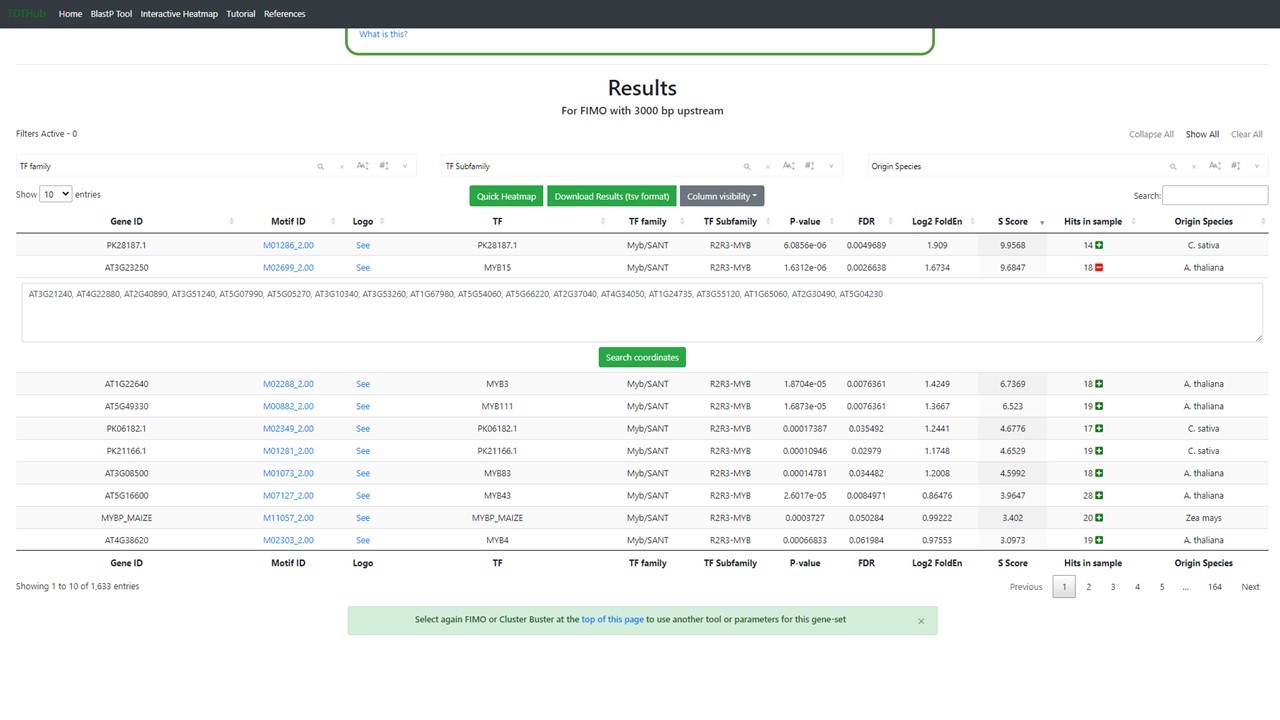
1.4 The results table is sorted by S-Score but can be sorted by any field by clicking the arrows next to each field. You can filter specific TFs, families, subfamilies in the filters area (1.1), and filter by any character using the search bar too (1.2). There are direct links to PWMs (3) and logos (4) for each binding site. Click on the “+” symbol to open the positive hits for each binding site. There are additional useful tools in the bar 5. From left to right, a direct link to a representation of the data in a heatmap, a button to download the results, and a button to hide or show all the columns in the table.

2. How to identify the genes that contains a specific Motif and its coordinates?
2.1 Click on “Search coordinates” once the previous step is finished (1.4).
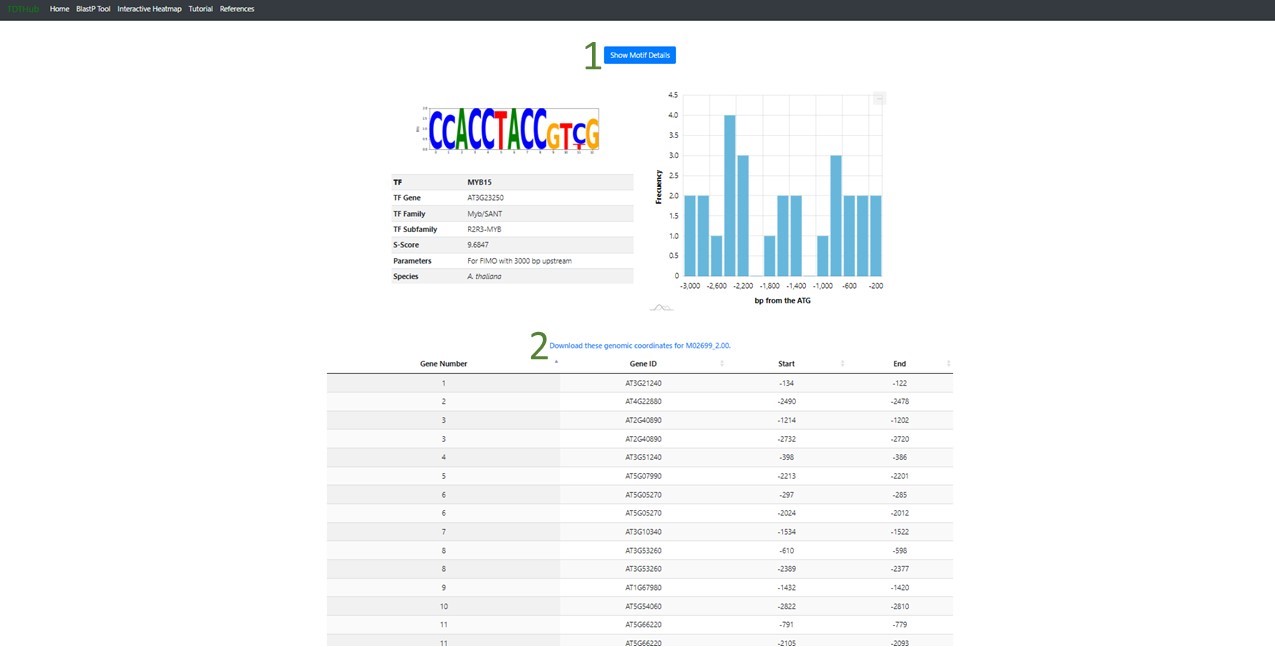
2.2 There is a button that display the Motif details (1), like the logo, the position of each binding site found relative to the AUG codon, or Translation Initiation Codon (TIC). The coordinates table can be sorted by any field. Transcription Factor Binding Site coordinates refer to the TIC and can be downloaded clicking in "2".
3. How to predict the Best Reciprocal BlastP Hits (BRH) for my gene set in other species?
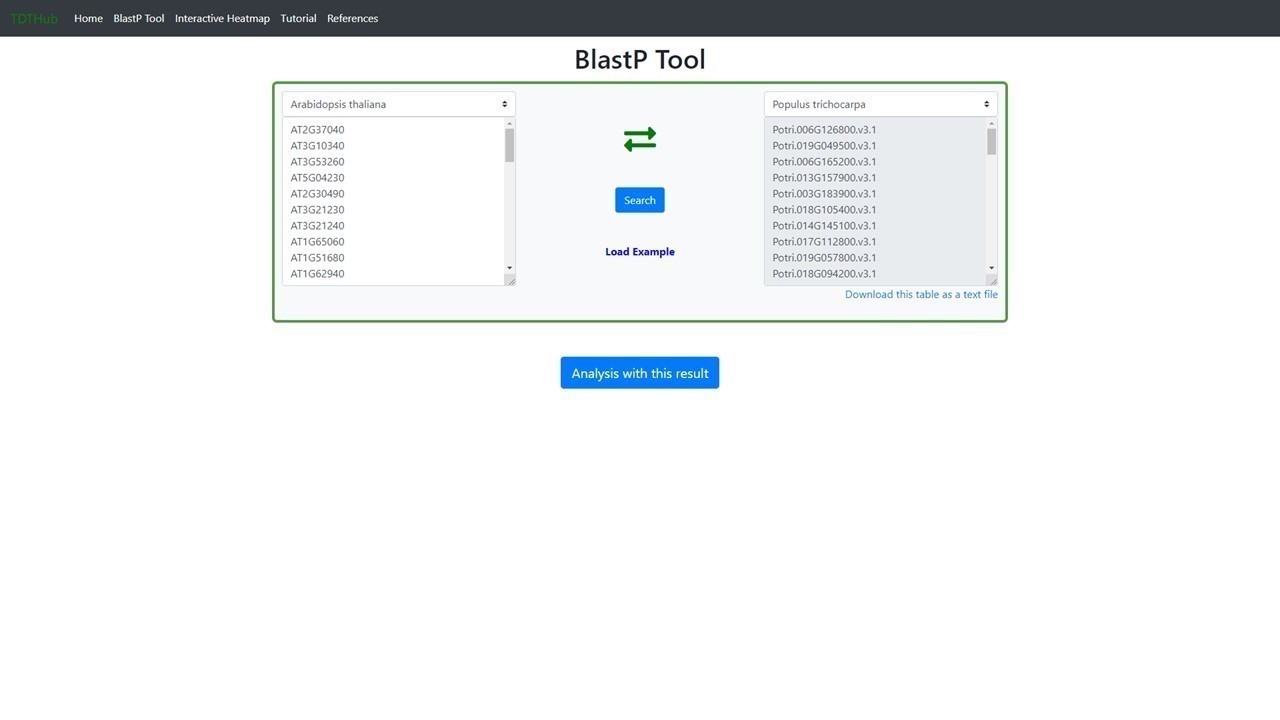
3.1 This tab allows to obtain a list of BRH genes for Arabidopsis in any species and vice versa. Paste your gene set of Arabidopsis on the left text box and select your target species on the right menu. You can change the direction of the BRHs search by clicking on the crossed green arrows.

3.2 BRH ortholg genes can be downloaded or launched for a new TFBS enrichment analysis (see question 1 in this tutorial).
4. How to visualize multiple TDTHub results in a heatmap plot?
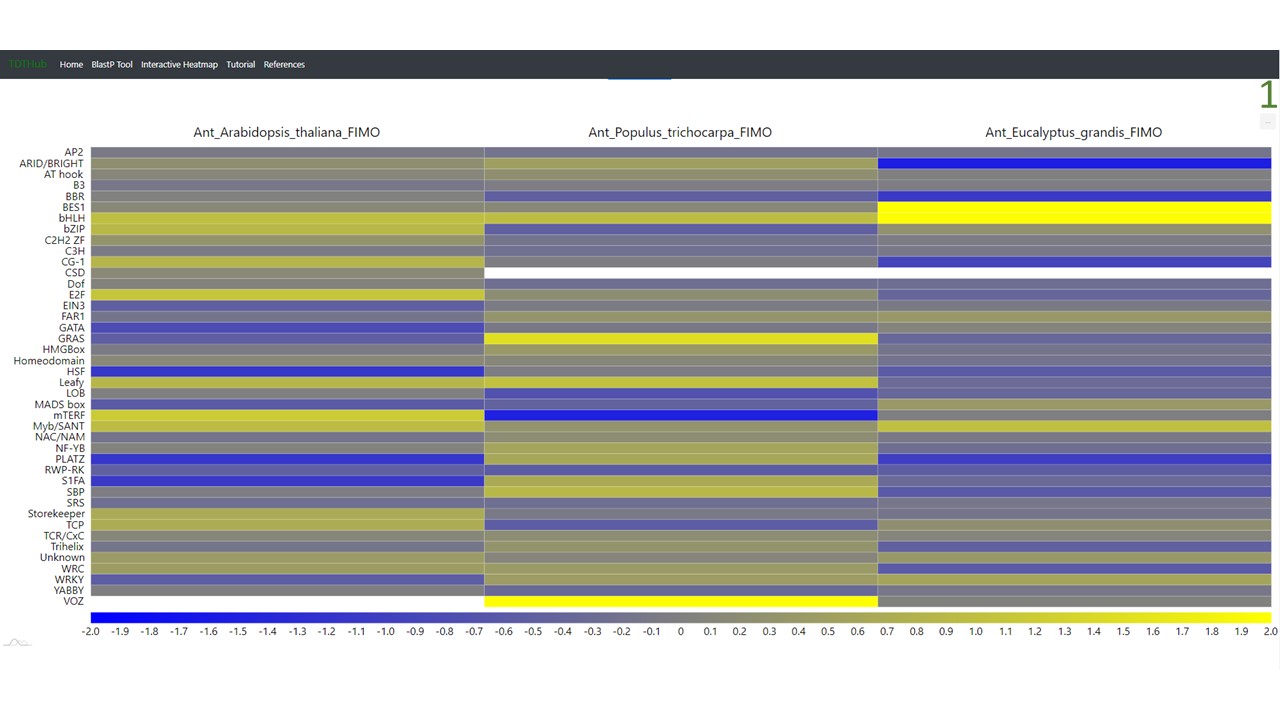
4.1 The interactive heatmap allows to compare results of TFBS among multiple species or conditions. The tool starts by uploading the results tables obtained in the main tool (up to 20 tables can be analyzed at once)(1). Select the parameter and the color scale to show in the heatmap (2). Data can be represented by individual TFBSs, or grouped by TF family or subfamily (3). You can explore different heatmap outputs by modifying the parameters and clicking on "Plot heatmap".

4.2 Publication quality images generated from the interactive heatmap and the data represented can be downloaded (1).
